
Skip to content
Free Excel Tutorials
  • Home
  • Excel For Beginners
  • Excel Intermediate
  • Advanced Excel For Experts

Data Analysis

  • What-If Analysis: Scenarios and Goal Seek in Excel
  • How to sum a total in multiple Excel tables
  • How to create Checklist in Excel
  • How to create Gauge Chart in Excel
  • How to create dynamic reference table name in Excel

References

  • How to get address of last cell in range in Excel
  • How to retrieve first match between two ranges in Excel
  • How to use Excel LOOKUP Function
  • INDEX function: Description, Usage, Syntax, Examples and Explanation
  • How to use Excel ROWS Function

Data Validations

  • Excel Data validation don’t exceed total
  • Excel Data validation must not contain
  • Excel Data validation specific characters only
  • Excel Data validation number multiple 100
  • Excel Data validation must contain specific text

How to use Excel CHOOSE Function

by

This Excel tutorial explains how to use the CHOOSE function with syntax and examples.

Excel CHOOSE function Description

The Microsoft Excel CHOOSE function returns a value from a list of values based on a given position.

The CHOOSE function is a built-in function in Excel that is categorized as a Lookup/Reference Function. It can be used as a worksheet function (WS) and a VBA function (VBA) in Excel. As a worksheet function, the CHOOSE function can be entered as part of a formula in a cell of a worksheet. As a VBA function, you can use this function in macro code that is entered through the Microsoft Visual Basic Editor.
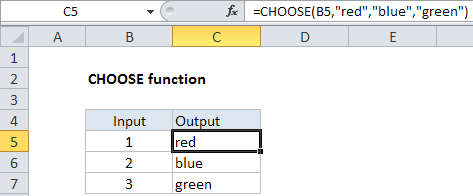
Explanation: The Excel CHOOSE function returns a value from a list using a given position or index. For example, CHOOSE(2,”red”,”blue”,”green”) returns “blue”, since blue is the 2nd value listed after the index number. The values provided to CHOOSE can include references.

Syntax

The syntax for the CHOOSE function in Microsoft Excel is:

CHOOSE( position, value1, [value2, ... value_n] )

Returns

The CHOOSE function returns any datatype such as a string, numeric, date, etc.
If position is less than 1, the CHOOSE function will return #VALUE!.
If position is greater than the number of the number of values in the list, the CHOOSE function will return #VALUE!.

Note: If position is a fraction (not an integer value), it will be converted to an integer by dropping the fractional component of the number.

Post navigation

Previous Post:

MDETERM function: Description, Usage, Syntax, Examples and Explanation

Next Post:

Sales Calculator in Excel

Leave a Reply Cancel reply

Your email address will not be published. Required fields are marked *

Learn Basic Excel

Ribbon
Workbook
Worksheets
Format Cells
Find & Select
Sort & Filter
Templates
Print
Share
Protect
Keyboard Shortcuts

Categories

  • Charts
  • Data Analysis
  • Data Validation
  • Excel Functions
    • Cube Functions
    • Database Functions
    • Date and Time Functions
    • Engineering Functions
    • Financial Functions
    • Information Functions
    • Logical Functions
    • Lookup and Reference Functions
    • Math and Trig Functions
    • Statistical Functions
    • Text Functions
    • Web Functions
  • Excel VBA
  • Excel Video Tutorials
  • Formatting
  • Grouping
  • Others

Logical Functions

  • IF with wildcards in Excel
  • Excel If, Nested If, And/Or Criteria Examples
  • How to use IFS function in Excel
  • IF, AND, OR and NOT Functions Examples in Excel
  • NOT function: Description, Usage, Syntax, Examples and Explanation

Date Time

  • Extract date from a date and time in Excel
  • How to show last updated date stamp in Excel
  • ISOWEEKNUM function: Description, Usage, Syntax, Examples and Explanation
  • EOMONTH function: Description, Usage, Syntax, Examples and Explanation
  • YEAR function: Description, Usage, Syntax, Examples and Explanation

Grouping

  • Group numbers at uneven intervals in Excel
  • Map text to numbers in Excel
  • Group arbitrary text values in Excel
  • Categorize text with keywords in Excel
  • How to randomly assign data to groups in Excel

General

  • How to add sequential row numbers to a set of data in Excel
  • Excel Ribbon Quick Overview For Beginners
  • Subtotal by color in Excel
  • How to generate random number weighted probability in Excel
  • How to calculate percent sold in Excel
© 2026 xlsoffice . All Right Reserved. | Teal Smiles | Abbreviations And Their Meaning