
How To Insert and Customize Sparklines in Excel
Sparklines in Excel are graphs that fit in one cell and give you information about the data.
Insert Sparklines
To insert sparklines, execute the following steps.
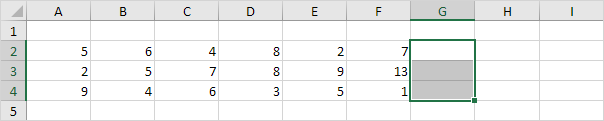
1. Select the cells where you want the sparklines to appear. In this example, we select the range G2:G4.
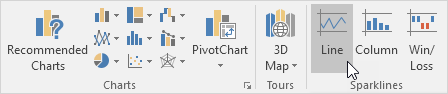
2. On the Insert tab, in the Sparklines group, click Line.
3. Click in the Data Range box and select the range A2:F4.
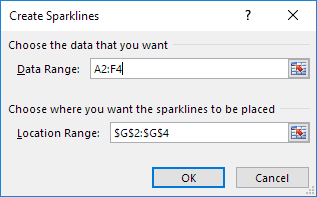
4. Click OK.
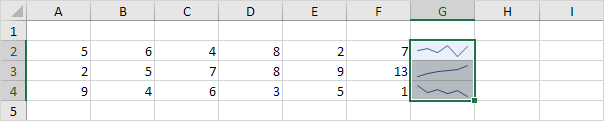
Result:
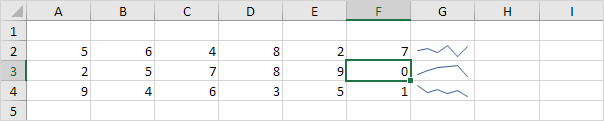
5. Change the value of cell F3 to 0.
Result. Excel automatically updates the sparkline.
Customize Sparklines
To customize sparklines, execute the following steps.
1. Select the sparklines.
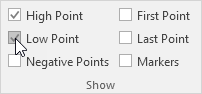
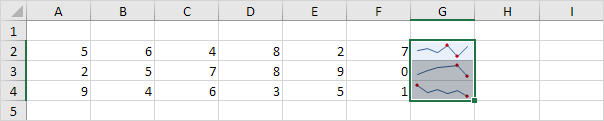
2. On the Design tab, in the Show group, check High Point and Low point.
Result:
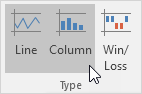
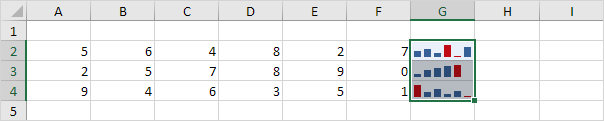
3. On the Design tab, in the Type group, click Column.
Result:
To delete a sparkline, execute the following steps.
4. Select 1 or more sparklines.
5. On the Design tab, in the Group group, click Clear.
